If your brand has a business Facebook page, you'll want to invest time understanding your Insights dashboard.
It holds important data that helps you understand how your page is performing and is key to growing your page.
Features like weekly insight summaries and competitive data on other business pages make Facebook Insights a powerful tool that every marketer should leverage.
Let's dive into what Facebook Insights is, how to access it, and how to interpret the metrics it tracks.
Facebook Page Insights vs. Facebook Audience Insights
Despite having similar names, Facebook Insights and Facebook Audience Insights have completely different functions.
Facebook Insights visualizes incoming data from your business page so you can learn how users are behaving on your page, what content they're engaging with, and how your page matches up to competitors.
Facebook Audience Insights, on the other hand, is used for ad campaigns and helps marketers understand Facebook audiences in general (which can also include those who follow your page).
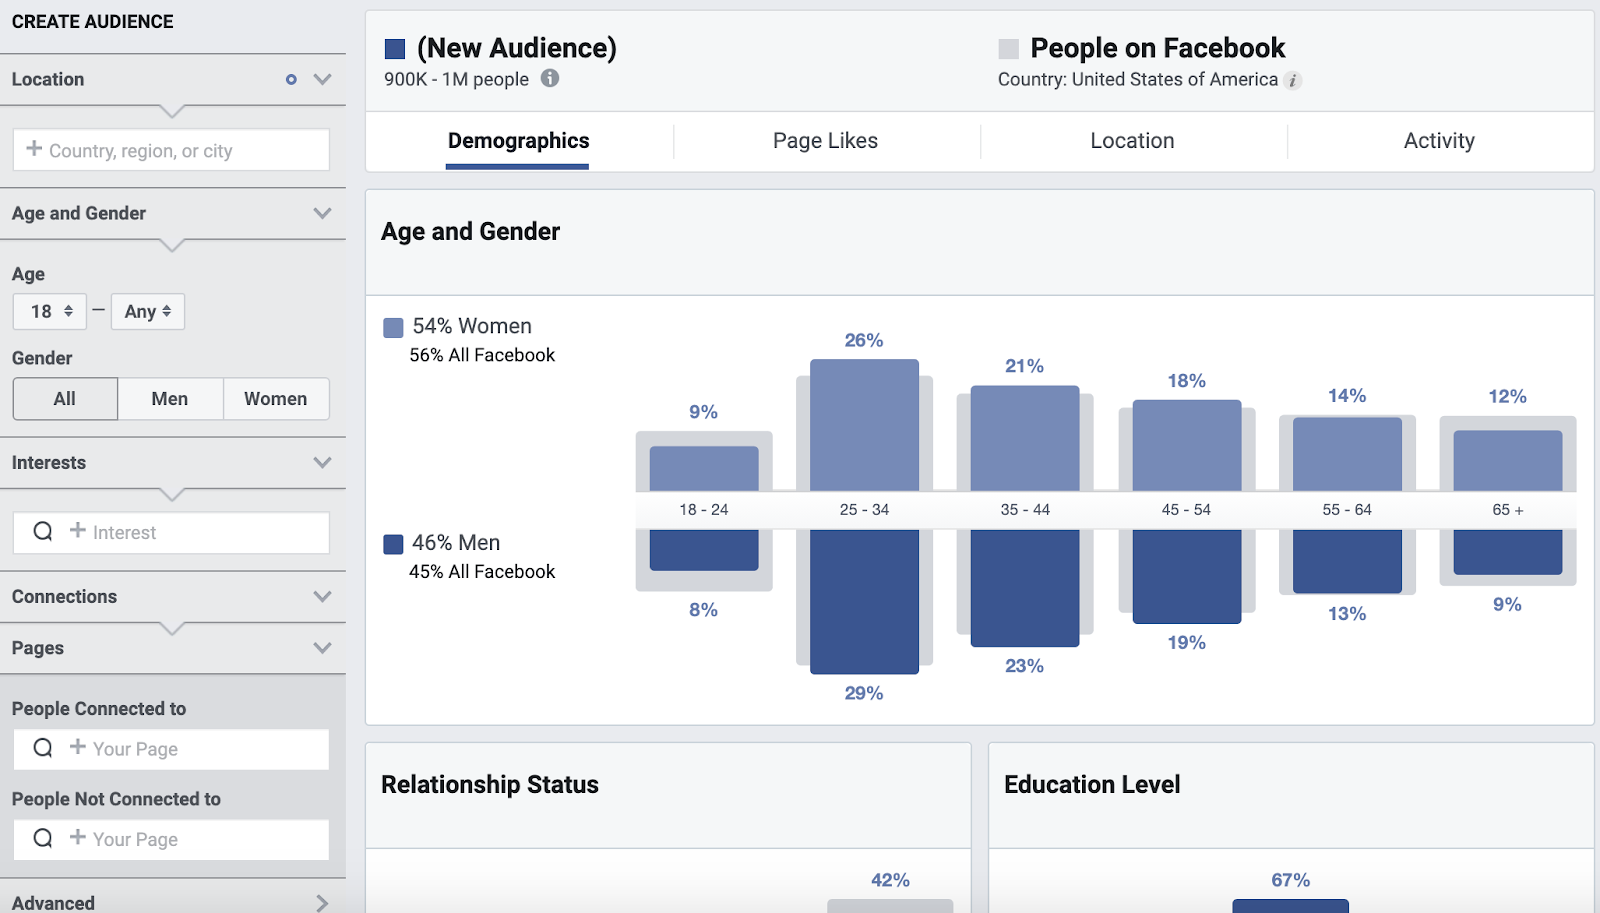
The platform includes information on user demographics, such as location and relationship status as well as user behavior, including average ad clicks and comments.
Where is Facebook Insights?
To access Facebook Insights, you'll need to have a business page. Then, follow the steps below:
-
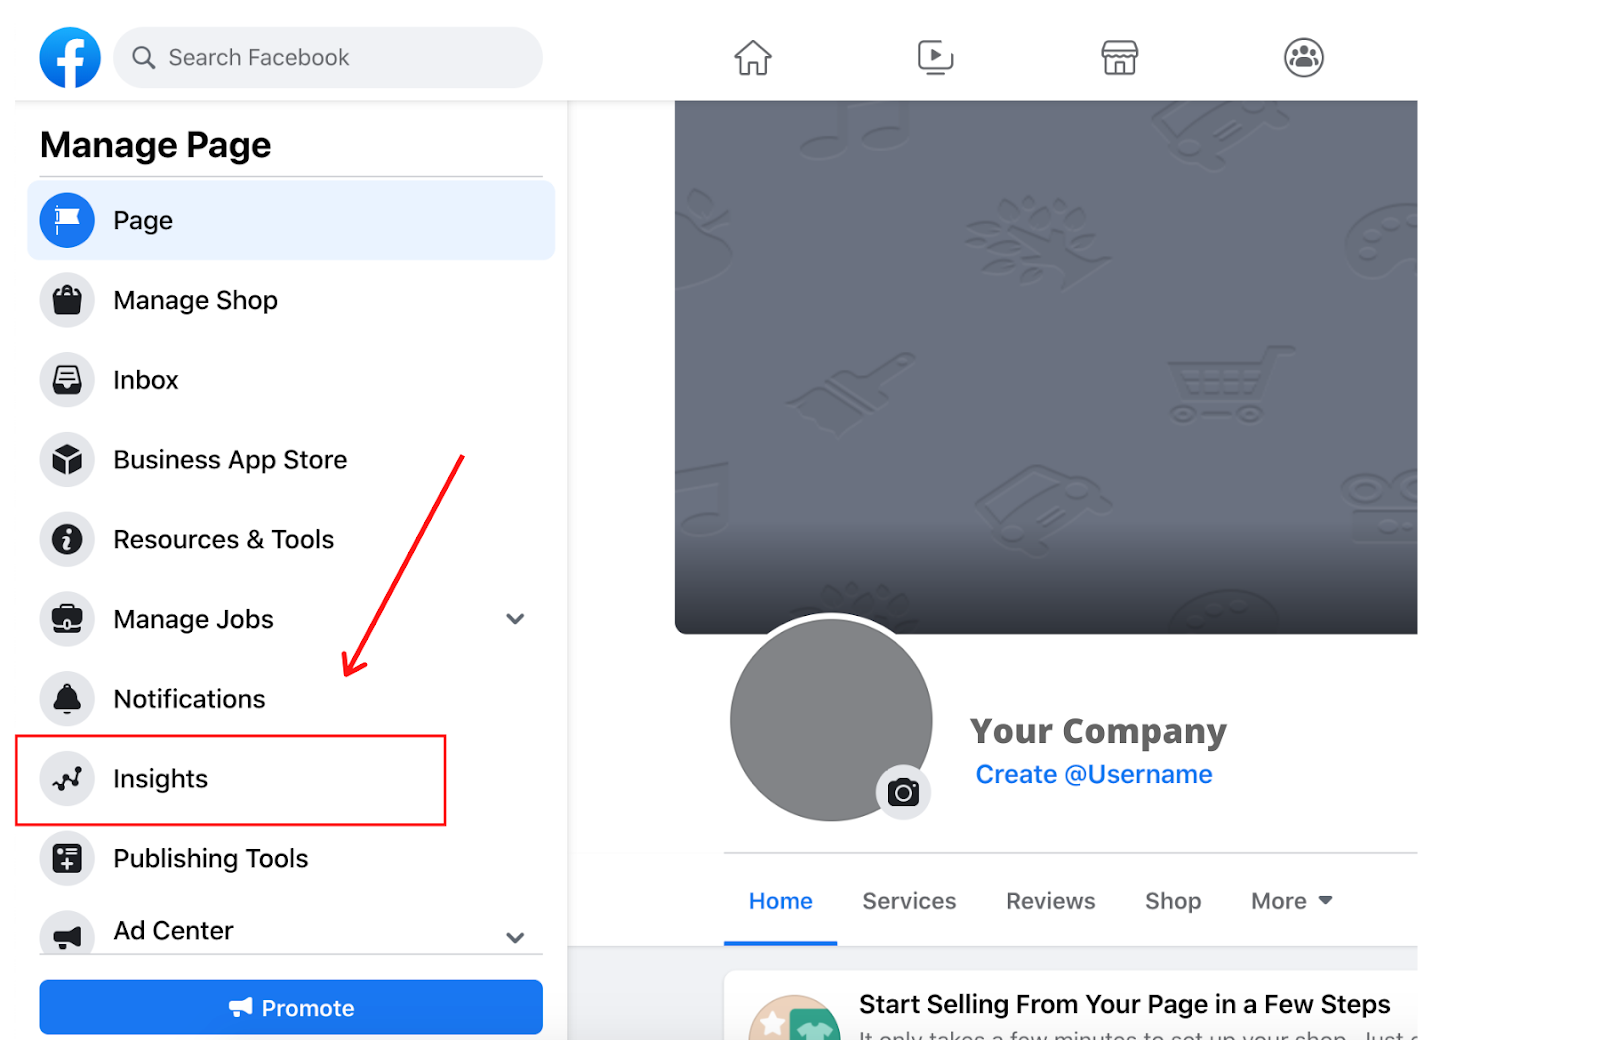
Once you log into Facebook, head to your business page. Then, click on "Insights," located on the sidebar to the left of the page.
-
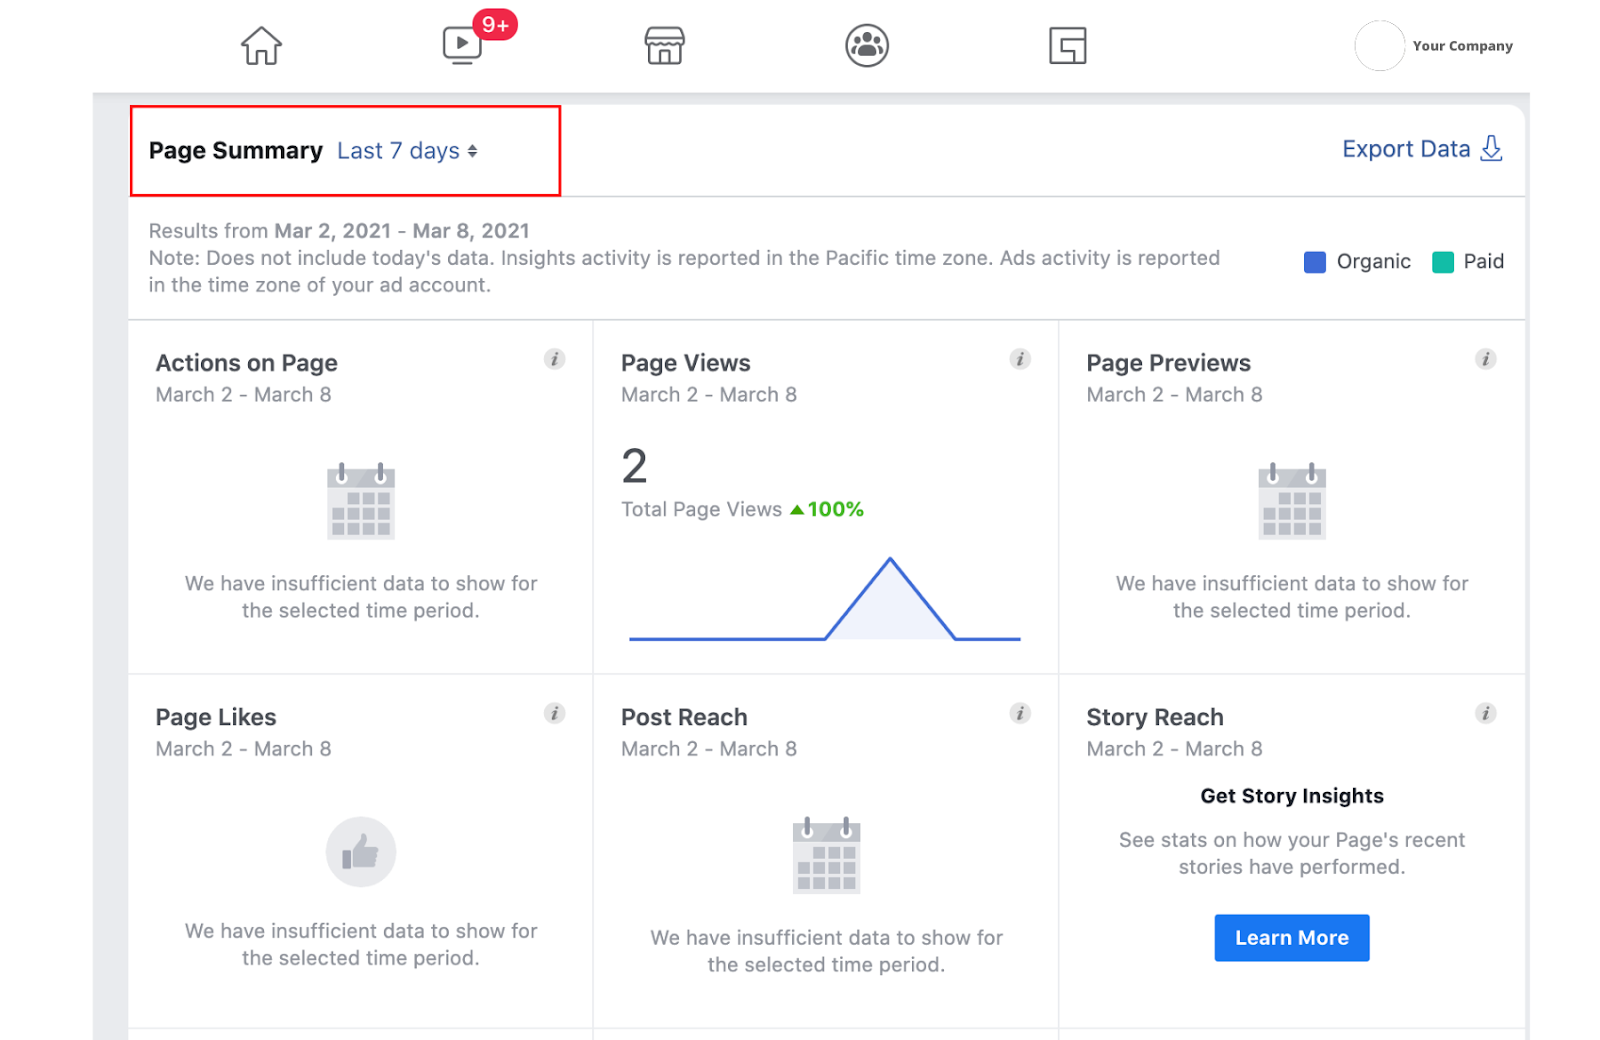
You'll land on the "Overview" page which features a dashboard with three main categories. The first is your page summary, which shows key metrics from the last seven days. However, you can also view data from today, yesterday, and the last 28 days.
-
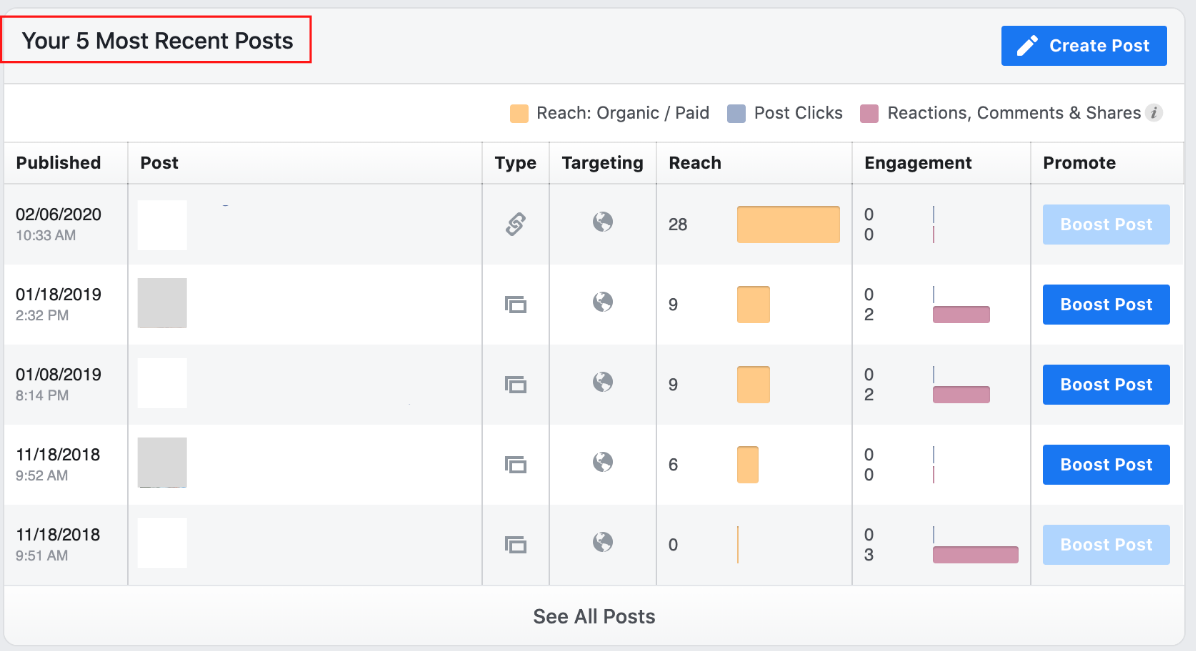
Once you scroll down, you'll see insights on your most recent posts.
-
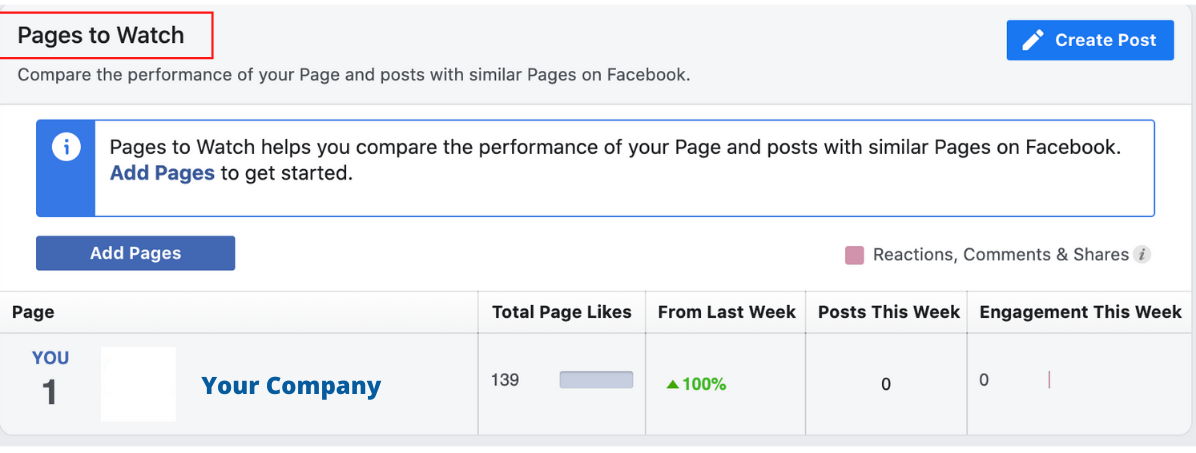
The last section features insights from your competitors. In this section, Facebook can recommend pages to watch, but you can also customize which brands' performance you track by clicking "Add Pages."
-
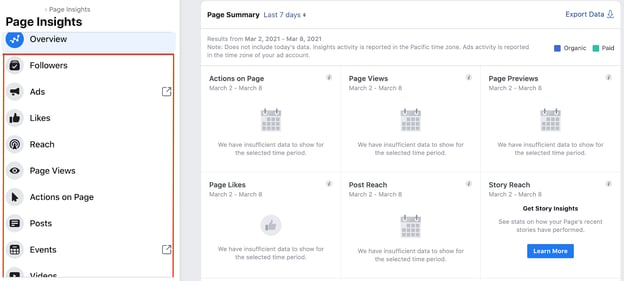
To dive deeper into these metrics, you can click each category listed on the sidebar to the left of the dashboard.
How to Use the Facebook Insights API
The Facebook Insights API, also known as the Ads Insights API, allows you to fetch ad data to track your ad performance. The API is particularly useful because it allows marketers to pull the exact data they want to track, no matter how granular.
To fetch the data from the API, you must determine what data you want to pull and create an access token for that ad, so that only your team can access that information. You'll then need to determine where to import that data, like Google Sheets or HubSpot's ads software within the Marketing Hub.
It allows you to pull your Insights API into the platform and match it against with data already in the CRM. This will provide a better understanding of the customer journey and give you a 360-degree view of how your ads are performing.
How to Export Facebook Insights Data
-
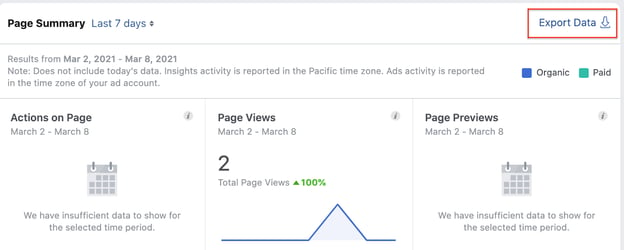
Start on your dashboard overview. On the top right corner of your "Page Summary," you'll see "Export Data."
-
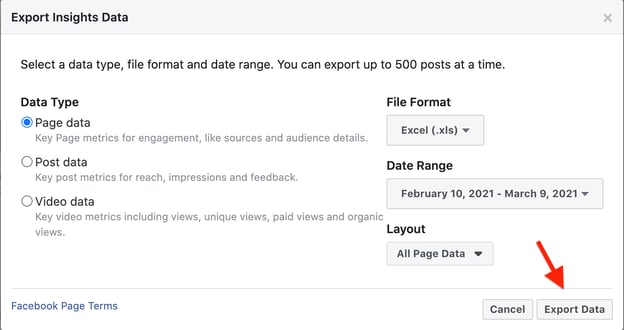
A window will pop up. From there, you'll narrow down what data to export, the data range, file format and layout.
-
Click "Export Data" and you're all set.
Top Facebook Insights Metrics
Your Facebook Insights dashboard displays top metrics about your business page. On any given day, you can get a snapshot of your page's performance and adjust your strategy accordingly. Top metrics include:
- Page views – The number of times your page has been viewed by Facebook and non-Facebook users.
- Page likes – How many Facebook users like your business page.
- Actions on page – How many actions users take on your business page, such as to click on a website link or ask for directions to your store.
- Post reach – The number of users on Facebook who saw your post.
- Post engagement – How many people liked, shared, reacted, or commented on your post.
You also have video insights, which can tell you how your videos are performing. Key metrics include:
- Minutes viewed – The total amount of time users have spent watching your videos.
- Video views – The number of users who watched your video for three seconds or more.
- Audience retention – How long you maintained your video's audience in a video.
For tips on how to interpret your video insights, jump to this section.
How to Interpret Facebook Insights
Before you start analyzing your data, make sure you know what questions you want answered. This will help you narrow down which key metrics to focus on.
Once you know that, start looking through the data to identify patterns.
For instance, let's say you notice that your how-to posts get shared at a much higher rate than your other content.This may indicate that this type of content resonates more with your audience and adds value to them and their community. As such, you may want to double down on these posts if your goal is to get higher engagement.
Analyzing the data is one thing, but what's more important is what you do next. As you notice trends, take note of them and conduct experiments to learn more about what your audience wants. This will help you learn more about your audience and develop content that meets their needs.
If your team wants to focus on video insights, scroll down to the "Videos" tab on the left sidebar and click on it. Once there, you'll see your top video metrics, such as watch time and top video performers.
For tips on how to understand your video insights, watch the video below. It dives into how to navigate your video insights dashboard and what your insights can tell you broken down by performance, loyalty, audience, and retention.
Your Facebook Insights dashboard holds so much information about your page's performance and your audience. If you leverage that data, you can create better content and generate more revenue for your brand.
from Marketing https://blog.hubspot.com/marketing/facebook-insights
If your brand has a business Facebook page, you'll want to invest time understanding your Insights dashboard.
It holds important data that helps you understand how your page is performing and is key to growing your page.
Features like weekly insight summaries and competitive data on other business pages make Facebook Insights a powerful tool that every marketer should leverage.
Let's dive into what Facebook Insights is, how to access it, and how to interpret the metrics it tracks.
Facebook Page Insights vs. Facebook Audience Insights
Despite having similar names, Facebook Insights and Facebook Audience Insights have completely different functions.
Facebook Insights visualizes incoming data from your business page so you can learn how users are behaving on your page, what content they're engaging with, and how your page matches up to competitors.
Facebook Audience Insights, on the other hand, is used for ad campaigns and helps marketers understand Facebook audiences in general (which can also include those who follow your page).

The platform includes information on user demographics, such as location and relationship status as well as user behavior, including average ad clicks and comments.
Where is Facebook Insights?
To access Facebook Insights, you'll need to have a business page. Then, follow the steps below:
-
Once you log into Facebook, head to your business page. Then, click on "Insights," located on the sidebar to the left of the page.

-
You'll land on the "Overview" page which features a dashboard with three main categories. The first is your page summary, which shows key metrics from the last seven days. However, you can also view data from today, yesterday, and the last 28 days.

-
Once you scroll down, you'll see insights on your most recent posts.

-
The last section features insights from your competitors. In this section, Facebook can recommend pages to watch, but you can also customize which brands' performance you track by clicking "Add Pages."

-
To dive deeper into these metrics, you can click each category listed on the sidebar to the left of the dashboard.

How to Use the Facebook Insights API
The Facebook Insights API, also known as the Ads Insights API, allows you to fetch ad data to track your ad performance. The API is particularly useful because it allows marketers to pull the exact data they want to track, no matter how granular.
To fetch the data from the API, you must determine what data you want to pull and create an access token for that ad, so that only your team can access that information. You'll then need to determine where to import that data, like Google Sheets or HubSpot's ads software within the Marketing Hub.
It allows you to pull your Insights API into the platform and match it against with data already in the CRM. This will provide a better understanding of the customer journey and give you a 360-degree view of how your ads are performing.
How to Export Facebook Insights Data
-
Start on your dashboard overview. On the top right corner of your "Page Summary," you'll see "Export Data."

-
A window will pop up. From there, you'll narrow down what data to export, the data range, file format and layout.

-
Click "Export Data" and you're all set.
Top Facebook Insights Metrics
Your Facebook Insights dashboard displays top metrics about your business page. On any given day, you can get a snapshot of your page's performance and adjust your strategy accordingly. Top metrics include:
- Page views – The number of times your page has been viewed by Facebook and non-Facebook users.
- Page likes – How many Facebook users like your business page.
- Actions on page – How many actions users take on your business page, such as to click on a website link or ask for directions to your store.
- Post reach – The number of users on Facebook who saw your post.
- Post engagement – How many people liked, shared, reacted, or commented on your post.
You also have video insights, which can tell you how your videos are performing. Key metrics include:
- Minutes viewed – The total amount of time users have spent watching your videos.
- Video views – The number of users who watched your video for three seconds or more.
- Audience retention – How long you maintained your video's audience in a video.
For tips on how to interpret your video insights, jump to this section.
How to Interpret Facebook Insights
Before you start analyzing your data, make sure you know what questions you want answered. This will help you narrow down which key metrics to focus on.
Once you know that, start looking through the data to identify patterns.
For instance, let's say you notice that your how-to posts get shared at a much higher rate than your other content.This may indicate that this type of content resonates more with your audience and adds value to them and their community. As such, you may want to double down on these posts if your goal is to get higher engagement.
Analyzing the data is one thing, but what's more important is what you do next. As you notice trends, take note of them and conduct experiments to learn more about what your audience wants. This will help you learn more about your audience and develop content that meets their needs.
If your team wants to focus on video insights, scroll down to the "Videos" tab on the left sidebar and click on it. Once there, you'll see your top video metrics, such as watch time and top video performers.
For tips on how to understand your video insights, watch the video below. It dives into how to navigate your video insights dashboard and what your insights can tell you broken down by performance, loyalty, audience, and retention.
Your Facebook Insights dashboard holds so much information about your page's performance and your audience. If you leverage that data, you can create better content and generate more revenue for your brand.


No hay comentarios:
Publicar un comentario